A couple of things caught my eye this week that made me want to update this ‘Contango vs Backwardation in Oil Prices’ resource.
The first was this news story:
+US shale bosses tell Europe: ‘There’s no bailout coming’ – FT
The second was a tweet where someone asked about spreads. As a learning community, we always take note of little reminders that not everyone is familiar our industry.
There are always newcomers, and there’s always more to learn.
Video: Contango Vs. Backwardation
We made this video a while back, and sure the production shows. Hey, we were learning as we went as well!
But the concepts are the same, and while we dive into these concepts further below, this short video may be what you need.
What is the Curve?
The first thing to remember is that commodities futures are not like equity prices. Equities are a discounting mechanism where all future cash flows are discounted to one present value.
This present value is the stock price you see quoted all day.
Futures contracts, on the other hand, represent the price that a buy and seller agree to exchange a commodity at a certain time in the future.
There are futures contracts expiring every month going out years into the future. And the prices of these individual contracts reflect value expectations at that point in time.
The prices of this series of contracts, plotted over time, is what creates what is called the price curve.
The WTI Price Curve on Sept. 14, 2022
I used the CME WTI settlements to produce the curve below. I’m no DataViz expert, but you get the idea.
What do you see looking at this chart?
First, there are futures contracts priced out to December 2030 (in over-the-counter markets, prices are available much further out). Second, that prices decline going out into the future.
Why?
This pricing structure is called backwardation. It isn’t normal for physical commodities to price this way for reasons we outline below. But you can point to the combination of global economies emerging from the pandemic and the Russian war in Ukraine as reasons for increased demand in prompt months.
To put it another way, people want oil NOW.
The important thing to understand with the price curve is what the news doesn’t tell you. When the news says ‘Oil is at $90, why don’t they pump more?’. Well, this is why.
It may take years to bring a new field into production, with billions of dollars in investment. And what this curve is telling investors and operators is that they can expect less than $70/bbl in 2025 and less than $60 in 2030.
If a producer was to use the financial markets to lock in prices for future production, these are the prices they would get, so a project has to make economic sense at these future prices, not today’s headline number.
Remember Negative Oil Prices?
Before refreshing this page, the tone was all about a market in steep contango (front prices below those in the future) leading to high demand for storage options, including just storing oil in tankers offshore.
Remember that? It was less than two years ago. Pretty wild, welcome to energy markets.
In fact, here’s a story in Vice News that featured yours truely ;):
+Why is the oil price negative and can you buy some? An explainer – Vice Motherboard
Of course, we’re living in a different world right now.
What is Backwardation?
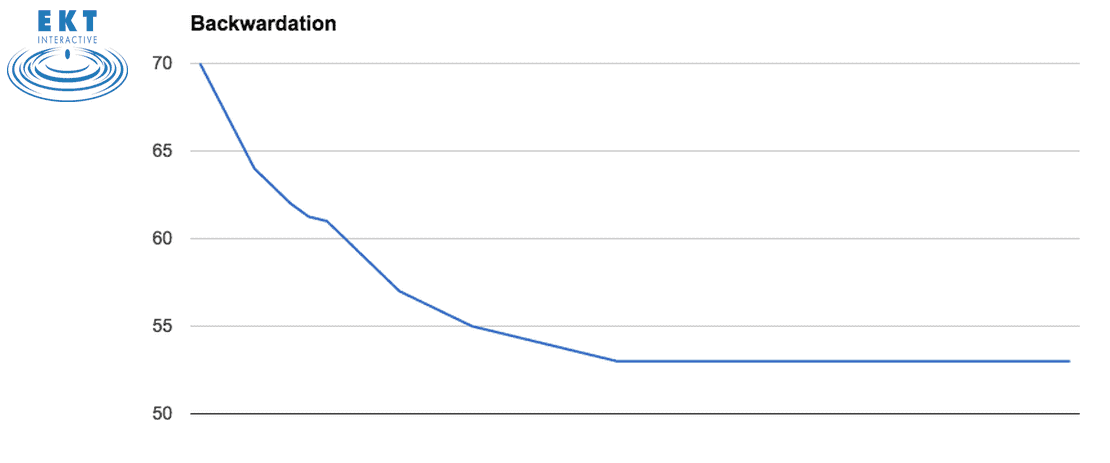
In a backwardated market there is a premium on current prices over the future.
This occurs when there is increased demand for a product NOW, as is the case in an expanding global economy post financial crisis (or post pandemic) or when there are supply disruptions due to politics, wars, or civil unrest in producing regions (ie, a near-global boycott of Russian oil).
A market that is steeply in backwardation often indicates a current shortage in the commodity. Additionally, it doesn’t pay to buy barrels now and stick them in storage until later. In fact, if you have oil in storage, you are incentivized to pull it out.
As we showed above, a backwardated oil price curve might look like this:

What is Contango?
When crude oil prices decline, there tends to be news stories covering interest in storage plays and demand for storage, both on land and using waterborne cargo vessels. This is driven by a Contango market pricing structure where prompt crude oil prices are below those in the future.
Now, if you aren’t familiar with the term ‘contango‘, you certainly aren’t alone.
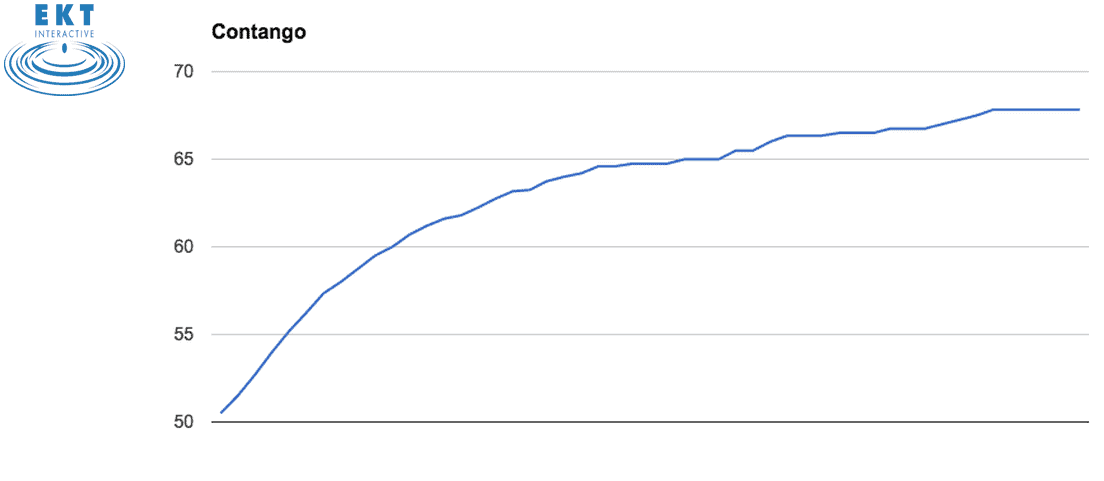
A contango market occurs when prompt crude oil prices fall below those further out in the future. There are futures contracts for each month going out many years. These prices reflect the market’s current as well as future expectations of oil prices.
Plotted in a chart with time on the x-axis and oil prices on the y-axis, these points create what is called the oil price ‘curve’.
A quick plotting of current oil prices by month(including the recent rebound) produces a curve like this :

Contango is considered normal for a non-perishable commodity, like crude oil and products, which have a cost of carry.
Such costs include storage fees and interest forgone on money that is tied up in inventory.
A steep enough curve, which covers the cost of carry, encourages oil traders and storage holders to buy crude oil at current prices and store it for sale at higher prices in the future.
Hedging in futures market allows the traders to ‘lock in’ this profitable economic scenario.
Contango conditions will lead to increased demand for oil storage.
Oil Prices, Beyond the Headline
So, remember, there’s more to oil prices than the headline number. It is important to have a basic understanding that adding rigs, developing new fields, investing in production, are all long term decisions.
These decisions have to make sense over a number of years. Understanding what is going on in the back of the price curve can give insight into why these decisions are being made.
Learn More with EKT Interactive

Whether you need energy industry training for yourself or for your team, EKT Interactive’s Energy 101 e-learning programs can help.